
In the autumn of 1989, as the Berlin Wall crumbled, two societies found themselves at analogous crossroads. Poland faced the challenge of constructing a market economy from scratch. South Africa, dismantling apartheid, confronted the imperative of reshaping a deeply unequal society. Both attracted international investors and reform-minded economists, yet took diverging paths.
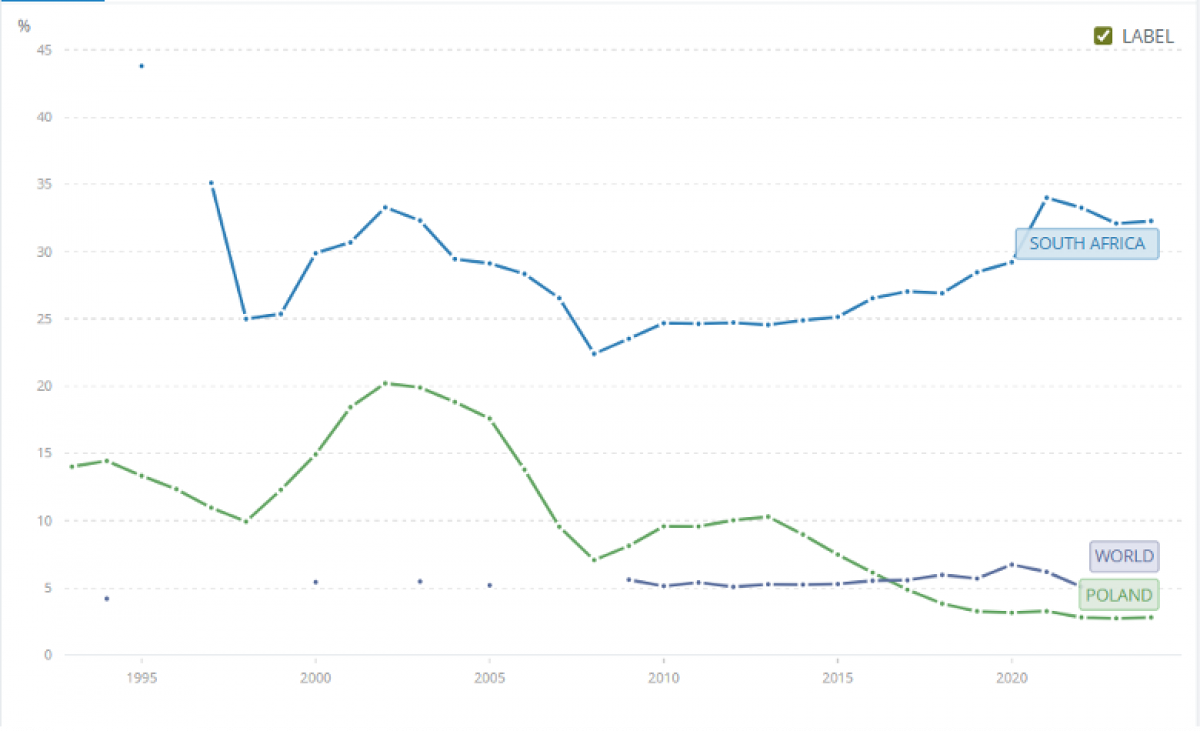
Poland’s economy has expanded by roughly 237% in real terms since 1990, the third-fastest in the EU behind Ireland and Malta.1 Unemployment has fallen to 3%.2 In 2009, when every other EU member contracted under the weight of the global financial crisis, Poland posted 2.8% growth, earning itself the nickname of the “green island”.3
“No country,” in the assessment of Harvard economist Dani Rodrik, “did better than Poland after the fall of communism.”4
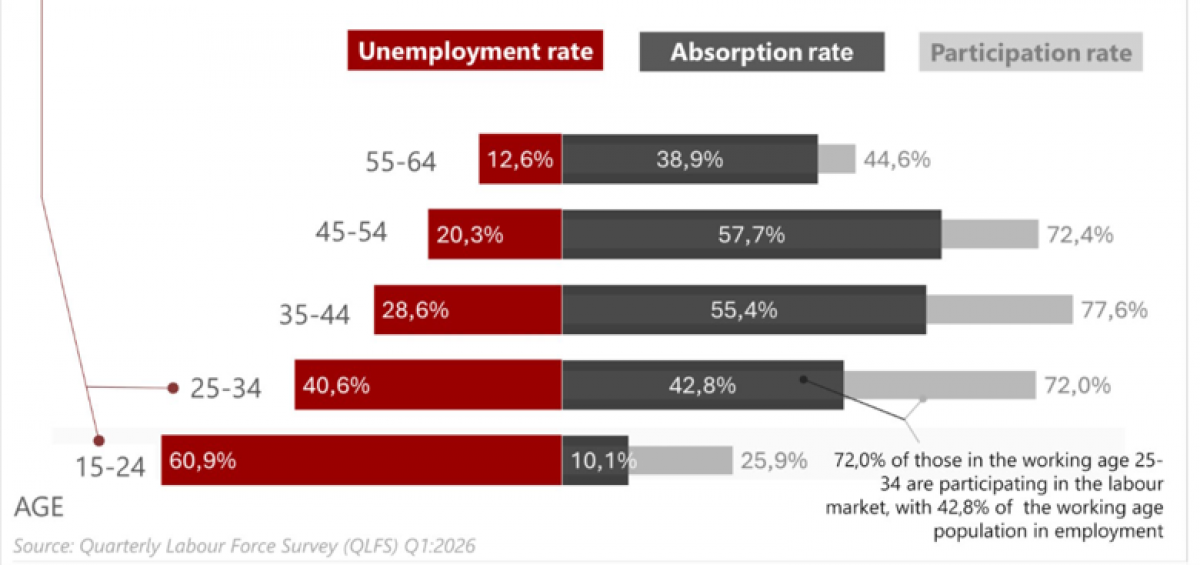
South Africa, meanwhile, has endured a cumulative 4.2% decline in real per capita GDP over the past decade and a governance crisis that has corroded the institutional foundations on which economic growth depends.5 Approximately one third (32.7% in Q1 2026) of South Africans are unemployed; among those aged 15-24, the rate is 60.9%.6
It is important to ask why.
The foundations: shock therapy and the Balcerowicz legacy
Poland’s transformation began with what the American economist Jeffrey Sachs termed “shock therapy”. The Balcerowicz Plan, launched on 1 January 1990, was the brainchild of Deputy Prime Minister (1989-1991; 1997-2000) Leszek Balcerowicz. It simultaneously liberalised prices and trade, tightened fiscal and monetary policy, and privatised state enterprises. Hyperinflation peaked above 600%, but was tamed within three years, and Poland had surpassed its communist-era GDP by 1995.7
This was a deliberate rupture away from communist-era vested interests. “1989 was one of the unique moments in Polish history,” Balcerowicz has recalled, “when society was so tired of communism that they were open to even very rapid free-market reforms.”8 Moving quickly denied old power networks time to organise resistance.
“The quicker and more radical the improvement in the economic system – if sustained – the faster the long-term economic growth. An early ‘Big Bang’, pioneered by Poland in 1990, … has proved much better than delayed, slow or inconsistent reforms,” Balcerowicz wrote in the Financial Times in 2014.9
Integration and acceleration: the EU dividend
European Union (EU) accession on 1 May 2004 was the second great inflection point. Poland received approximately €245 billion in gross EU transfers between 2004 and 2023, of which nearly €170 billion funded cohesion projects – Warsaw’s metro, Gdańsk’s port, and a motorway network that knitted the country together.10 The EU was not merely a source of funds but of institutional discipline: the acquis communautaire functioned as a constitutional constraint on political short-termism, embedding rule-of-law standards that survived three decades and multiple shifts in government.
The ingredients of a miracle: a diagnosis of Polish competitiveness
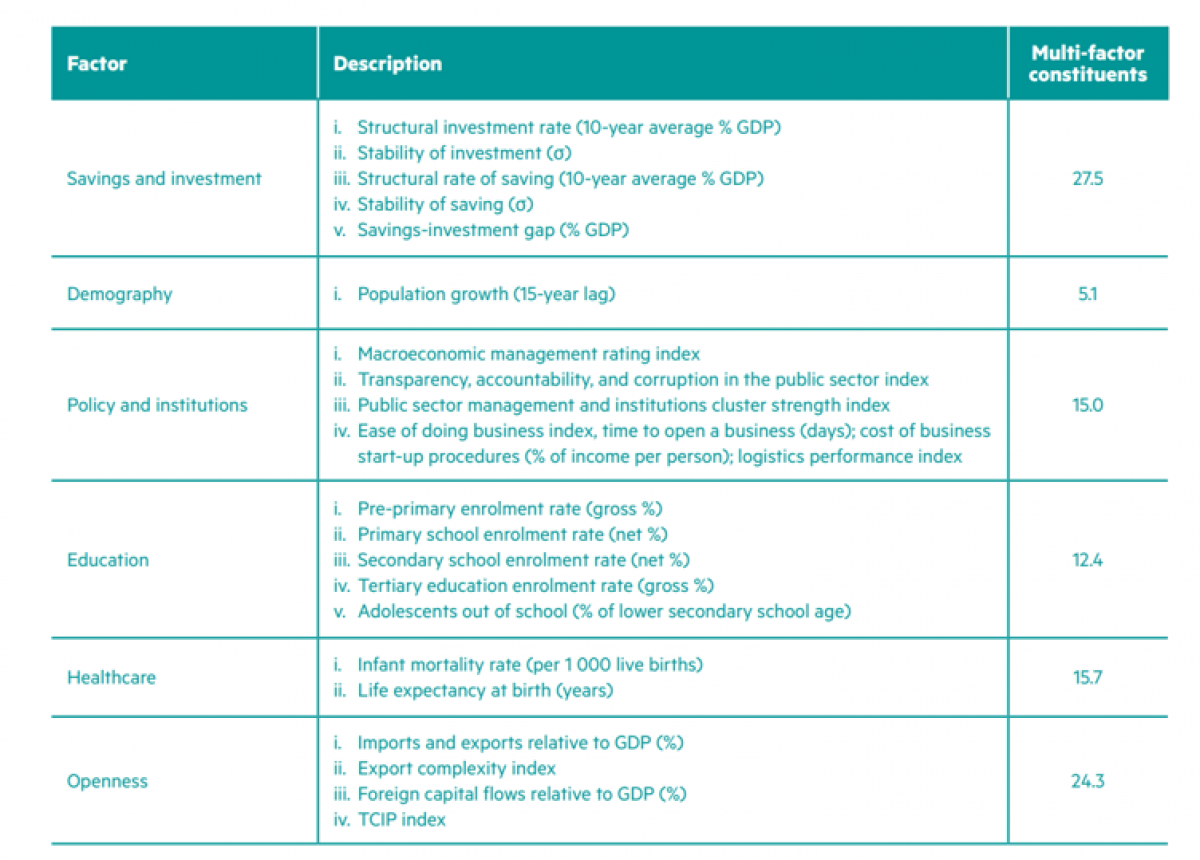
A powerful diagnostic lens is the six factor model, developed by Professor Adrian Saville and colleagues at the Gordon Institute of Business Science (GIBS).11 Drawing on data from 160 countries across more than six decades, the model ranks six structural drivers of economic growth by explanatory power.
“This work offers a practical tool that helps us understand Poland’s story,” says Saville. “What emerges is six common elements that explain economic ‘miracles’ – and disasters. Especially relevant to Poland is the ‘stable policies and institutions’ factor. I emphasise the word ‘stable’. Across time and markets, stability and predictability are greater drivers of prosperity than the policies themselves, barring extreme destructive policies.”
The “saving and investment” factor is the most powerful determinant of growth, with an R² of 27.5 – explaining more than a quarter of long-run prosperity variation.12
The six factor model
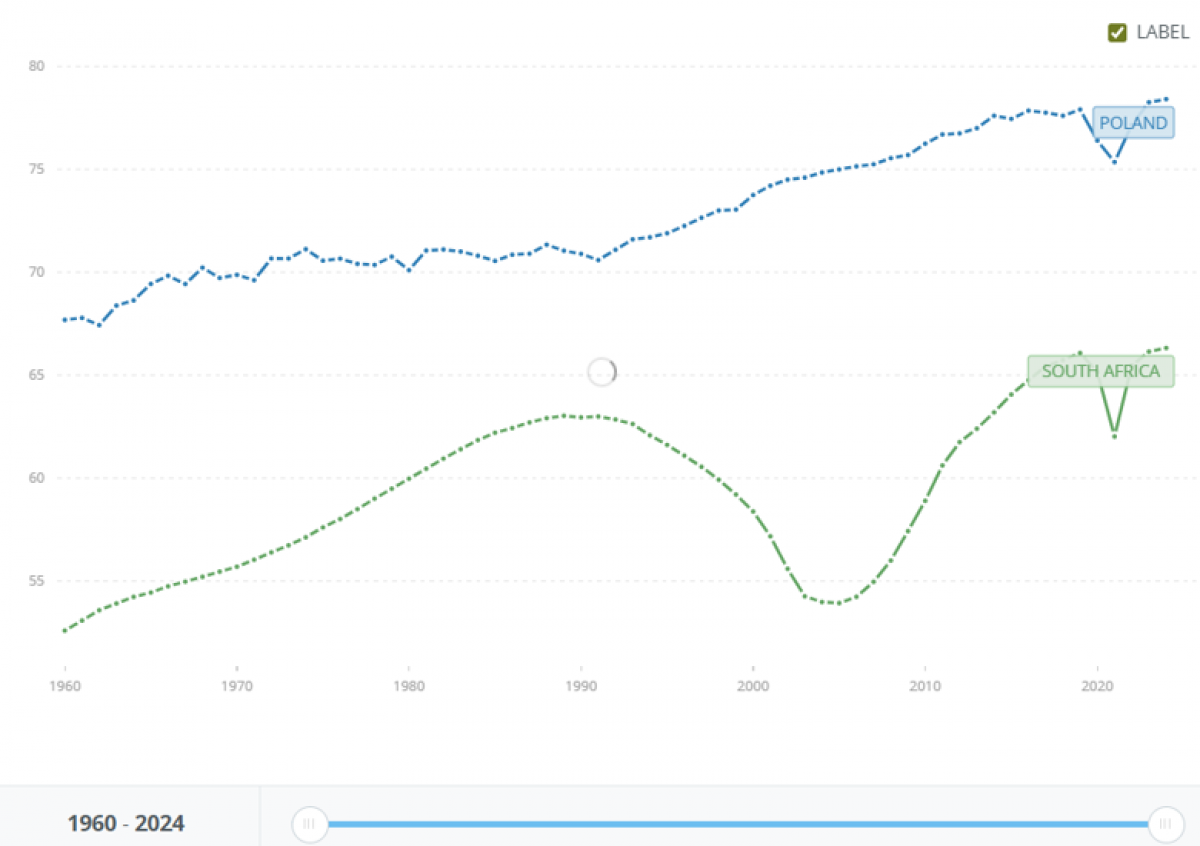
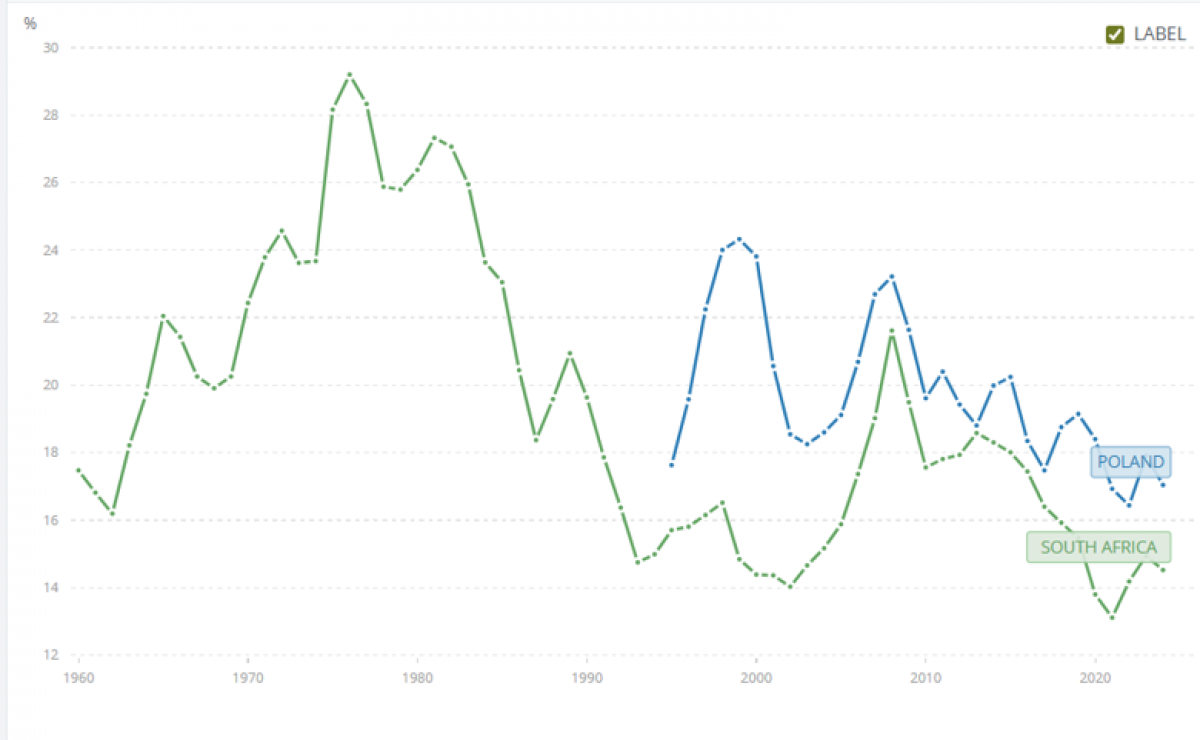
Poland scores strongly across all six. Gross fixed capital formation is two percentage points above South Africa’s13; life expectancy at birth has risen from 68 in 1960 to 78 by 202414; and PISA15 scores rank its high schoolers at 15th in the world16.
The South African contrast: institutions and the anatomy of failure
South Africa has proved the counterexample to Poland’s success story. “Despite decades of leadership by an ANC majority, policy uncertainty has been high,” says Saville. “One struggles to decipher a coherent, long-term strategy. Rather, we see an array of different and often-reactive policies.”
Gross fixed capital formation (% of GDP)
Both countries entered their transitions with comparable endowments: international goodwill, natural resources, and educated elites. South Africa’s failure to convert these advantages into broad-based prosperity reflects not external misfortune but systematic policy failure.17
“It is unfortunately clear that South Africa’s trajectory is not one of growth or inclusion,” say Timothy Kohler and Haroon Bhorat, of the Brookings Institution, “but rather stagnation and exclusion.”18
Against the six factor model, South Africa fails on nearly every dimension: savings under 14% of GDP19, chronically poor educational outcomes, and a collapsed energy utility that has destroyed productive capacity. Most telling is the Zuma presidency (2009–2018), during which politically connected networks systematically captured state institutions: the textbook case of what political economist Joel Hellman and his World Bank colleagues call the ability to “shape the rules of the game to their own advantage”.20
Estimates of the cumulative cost run as high as R1.5 trillion over Zuma’s second term alone.21 Where Poland’s EU anchor prevented such erosion, South Africa proved unable to generate an equivalent discipline from within.
Conclusions: the consequences of political will
Poland’s experience confirms what Michael Porter, the Harvard Business School professor of competitive strategy, argued in his foundational study: “National prosperity is created, not inherited. It does not grow out of a country’s natural endowments, its labour pool, its interest rates, or its currency’s value. A nation’s competitiveness depends on the capacity of its industry to innovate and upgrade.”22
Poland had no geographic windfall. Its deeper endowments were institutional and cultural. It leveraged an educated professional class and a long orientation toward Europe – assets the Balcerowicz Plan unlocked rather than created. South Africa’s persistent constraints, by contrast, are structural and slow to shift.
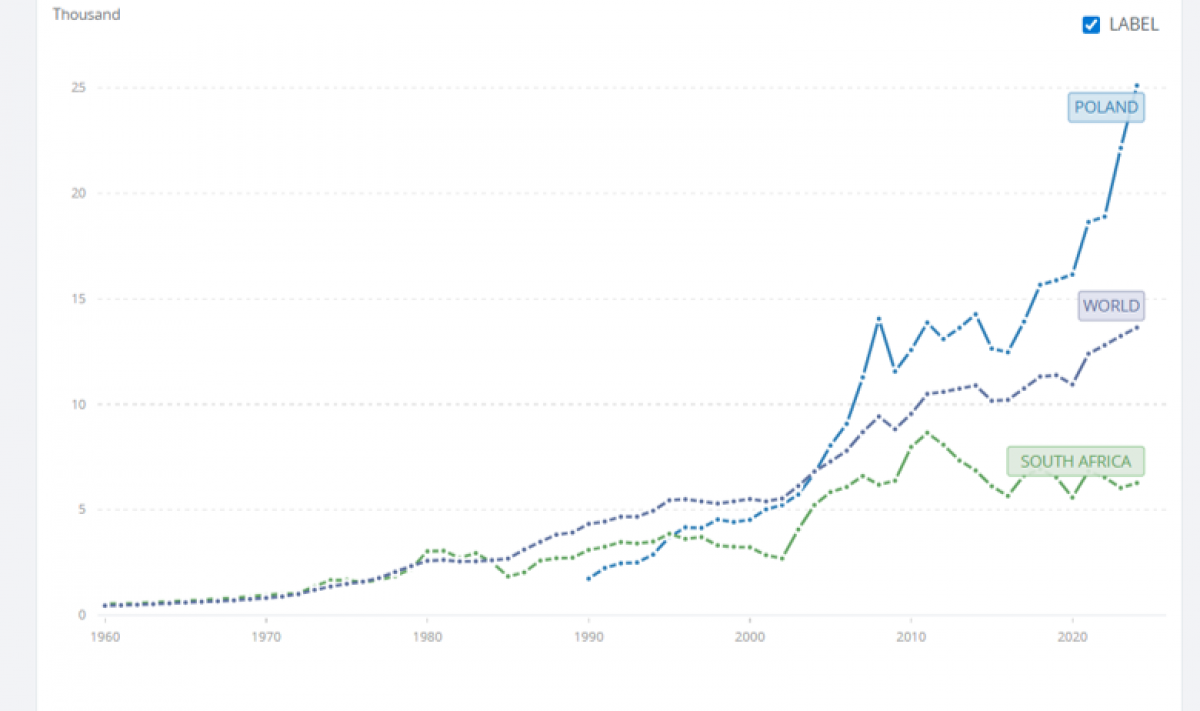
GDP per capita (current US$)
Poland and South Africa had almost identical income per person in 1995 – $3 701 versus $3 856, respectively, in current US dollars.23 Three decades later, South Africa has barely doubled that. Average income has even declined since 2007, making people poorer in both real and nominal terms.
Poland now surpasses $25 000 per person. Based on the latest IMF forecasts, Poland is set to overtake the likes of Israel, Spain, New Zealand, and Japan in GDP per capita on a purchasing power parity (PPP) basis.24
The story of the last three decades is a cautionary tale – but, if its lessons are taken, also a blueprint for a South African success story.
1 World Bank. (2024). World development indicators. World Bank Group; Notes from Poland. (2025, July 7). How Poland shook off its past and became Europe’s growth champion. notesfrompoland.com.
2 World Bank. (2025). Unemployment, total (% of total labour force) (modelled ILO estimate) – Poland. World Development Indicators. World Bank Group
3 International Monetary Fund. (2010, May 10). IMF executive board concludes 2010 Article IV consultation with the Republic of Poland [Public Information Notice No. 10/55]. imf.org; Hoover Institution. (2010, June 24). Why was Poland the only EU country to avoid recession? hoover.org.
4 Rodrik, D. (2018). Endorsement of M. Piątkowski, Europe’s growth champion: Insights from the economic rise of Poland. Oxford University Press.
5 World Bank. (2026). The World Bank in South Africa: Overview. World Bank Group. worldbank.org; International Monetary Fund. (2025, October). World economic outlook database. IMF. imf.org
6 Statistics South Africa. (2026). Quarterly labour force survey (QLFS): Quarter 1: 2026 (Statistical release P0211)
7 Piątkowski, M. (2018). Europe’s growth champion: Insights from the economic rise of Poland (p. 3). Oxford University Press.
8 Balcerowicz, L. (2025, September 6). Transformation to freedom: Interview with Leszek Balcerowicz. We Speak Freely. wespeakfreely.org.
9 Balcerowicz, L. (2014, June). [Commentary on 25 years of Polish economic transformation]. Financial Times. ft.com; as quoted in Christensen, L. (2014, June 5). Leszek Balcerowicz on Poland’s success. The Market Monetarist. marketmonetarist.com. The ellipsis marks an omitted clause crediting Estonia’s still more radical implementation.
10 Gazeta SGH. (2024, April 22). Financial flows between Poland and the EU in 2004–2023. gazeta.sgh.waw.pl; Vox Ukraine. (2023, September 11). Driving EU pre-accession: Poland’s unique model. voxukraine.org.
11 Binedell, N., Saville, A., & Macleod, I. (2025). Fate, luck and choice: Competitive strategy for every time and place. Gordon Institute of Business Science, Centre for African Management and Markets, University of Pretoria.
12 Binedell et al. (2025), pp. 23–2
13 World Bank (2024).
14 World Bank (2024).
15 Programme for International Student Assessment (PISA) is a globally standardised evaluation administered by the OECD that measures 15-year-old students' proficiency in mathematics, reading, and science
16 Programme for International Student Assessment (PISA) Scores by Country (2026). PISA.
17African Development Bank. (2025). South Africa economic outlook 2025. afdb.org; PwC Strategy&. (2025). South Africa economic outlook 2025. strategyand.pwc.com.
18Kohler, T., & Bhorat, H. (2023). South Africa’s economy: 30 years since apartheid. Brookings Institution. brookings.ed
19World Bank. (2025). Gross savings (% of GDP) – South Africa [13.3% in 2024]. World Development Indicators. World Bank Group. data.worldbank.org/indicator/NY.GNS.ICTR.ZS.
20Hellman, J. S., Jones, G., & Kaufmann, D. (2003). Seize the state, seize the day. Journal of Comparative Economics, 31(4), 751–773
21Heckel, M. (2025). State capture: Institutionalized corruption of the South African Revenue Service. Thunderbird International Business Review. https://doi.org/10.1002/tie.70018; Daily Maverick. (2019, March 1). State capture wipes out a third of SA’s R4.9-trillion GDP. dailymaverick.co.za.
22Porter, M. E. (1990). The competitive advantage of nations. Harvard Business Review, 68(2), 73–91.
23 World Bank.
24 Poland Accounting. (2025, May 12). IMF forecast: Poland to overtake Japan, Spain and Israel in GDP per capita by 2030. poland-accounting.eu; World Bank. (2024). GDP per capita PPP – Poland. World Development Indicators.


Gallery